
Intellicast is a well-known name in online weather forecasting, recognized for its detailed radar imagery, interactive weather maps, local forecasts, and storm-tracking capabilities. For many years, it helped users understand changing weather conditions through visual tools and accessible meteorological information. Its emphasis on radar, severe-weather monitoring, and localized forecasts made it a familiar resource for weather enthusiasts, travelers, outdoor workers, and people planning their daily activities.
Understanding Intellicast involves more than looking at its former website. Its history reflects the evolution of digital weather services, the growing importance of interactive radar, and the transition from specialized weather websites to integrated forecasting platforms. Although the original Intellicast experience has changed significantly, its name remains associated with detailed weather visualization and practical forecasting tools.
Quick Information Table About Intellicast
| Information | Details |
|---|---|
| Name | Intellicast |
| Main purpose | Online weather forecasting and weather visualization |
| Primary specialty | Interactive radar maps and weather imagery |
| Original website | intellicast.com |
| Main features | Radar, satellite imagery, temperature maps, wind maps, precipitation data, and surface analysis |
| Historical audience | General users, travelers, outdoor enthusiasts, and weather watchers |
| Major transition | Began redirecting visitors on January 17, 2019 |
| Successor platform | Weather Underground |
| Current status | No longer operates as a separate weather website |
| Main legacy | Detailed weather maps and visual storm tracking |
| Best-known use | Monitoring precipitation and following approaching weather systems |

What Is Intellicast?
Intellicast was an online weather service designed to make weather information easier to understand through maps, radar imagery, and forecasting tools. Rather than relying exclusively on written forecasts or basic weather icons, it provided visual representations of atmospheric conditions that allowed users to explore weather patterns across different locations.
Its main appeal was the ability to examine weather activity in greater detail. Users could view precipitation moving across a region, observe temperature differences, examine satellite imagery, and follow developing weather systems. These capabilities made Intellicast particularly useful for people who wanted more context than a simple daily forecast could provide.
The platform became especially associated with radar maps. Weather radar helps show where precipitation is occurring and how it moves over time. By combining radar imagery with other meteorological information, Intellicast offered a practical way to understand local and regional weather conditions.
Although the original website is no longer a standalone service, Intellicast remains a recognizable name in the history of online weather forecasting.
History and Development of Intellicast
Early Presence on the Internet
Intellicast emerged during the early development of commercial internet services, when online weather information was becoming increasingly accessible to ordinary users. Before weather websites became common, people often depended on television forecasts, radio broadcasts, newspapers, and telephone weather services.
The internet introduced a different approach. Users could seek weather information whenever they needed it and examine visual data rather than waiting for a scheduled broadcast.
Intellicast became part of this transition by providing weather maps and related information through its website. Its domain registration dates to 1995, placing it among the early names associated with commercial online weather services.
Growth in Weather Mapping
As internet technology improved, weather websites gained opportunities to display more detailed images and interactive information. Faster connections and better browser capabilities made animated radar and larger weather maps increasingly practical.
Intellicast developed a reputation for its map-based approach. Its weather imagery helped users observe precipitation patterns, compare regional conditions, and follow storms as they moved.
This visual emphasis distinguished the service from simpler forecast pages. For people interested in meteorology, the ability to interpret a weather system on a map was often more informative than reading a short summary of expected conditions.
Integration Into a Larger Weather Platform
A major change occurred on January 17, 2019, when the process of redirecting Intellicast.com visitors to Weather Underground began.
The transition was intended to preserve familiar weather technologies and features within the successor platform rather than maintain Intellicast as an independent website. A dedicated Intellicast map directory also helped users locate related weather products in the new environment.
This change marked the end of Intellicast's original identity as a separate online destination. Its name and historical significance remained, but the experience of accessing its weather information changed.
Main Features of Intellicast
Intellicast's reputation was built around several weather information tools. These features supported different needs, from checking everyday conditions to observing more complex weather developments.
1. Interactive Weather Radar
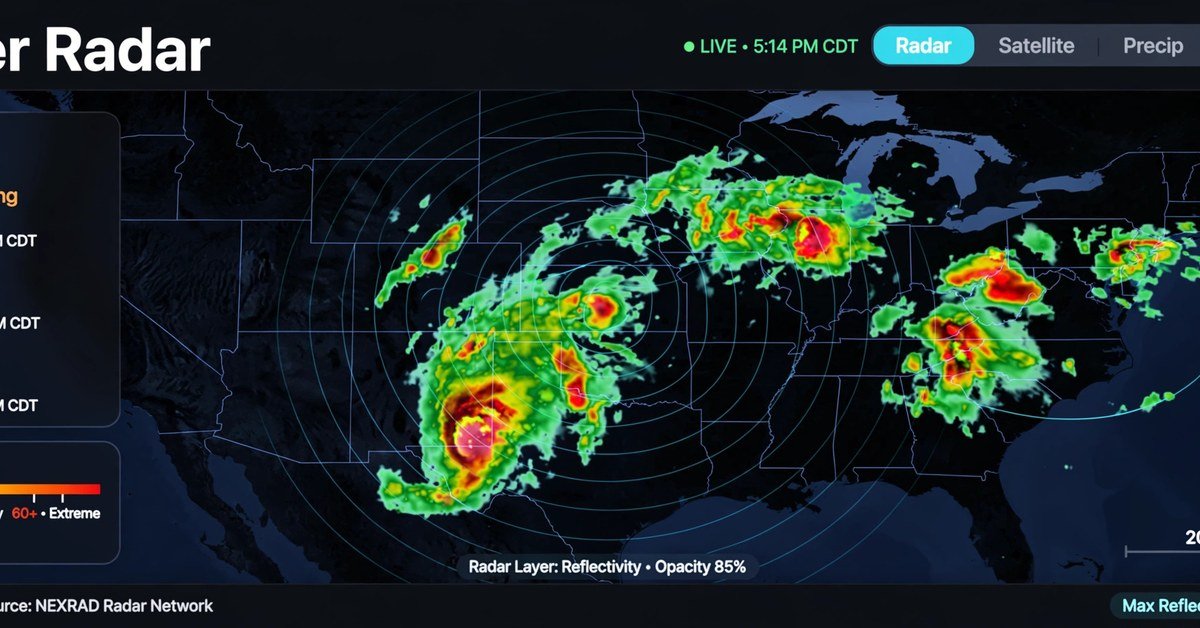
Radar was one of Intellicast's most recognizable features. It provided a visual representation of precipitation, helping users identify areas experiencing rain, snow, or other forms of precipitation detected by radar systems.
Radar maps were useful for answering practical questions:
• Is rain approaching my location? • Which direction is a storm moving? • Are precipitation bands becoming more widespread? • Is a weather system likely to affect a planned outdoor activity?
Animated radar loops added another layer of information by displaying changes over a period of time. Rather than examining a single image, users could watch precipitation patterns develop and move across a map.
Radar does have limitations. It estimates precipitation from returned signals and does not guarantee exactly what will occur at ground level. Terrain, distance from radar stations, atmospheric conditions, and the type of precipitation can affect the quality of the information.
2. Satellite Imagery
Satellite imagery provides a broader view of cloud cover and atmospheric systems. It complements radar by showing weather features that may extend across large areas, including regions where ground-based radar coverage is limited.
Visible satellite images show reflected sunlight and are generally most useful during daylight. Infrared imagery measures emitted energy and can be used to observe cloud-top temperatures both during the day and at night.
These views help users recognize extensive cloud systems, monitor developing disturbances, and understand the larger weather pattern surrounding a local forecast.
3. Temperature Maps
Temperature maps display observed or analyzed temperatures across geographic areas. They make it easier to compare conditions between cities, states, and wider regions.
These maps can help users understand temperature gradients, identify unusually warm or cold areas, and see how temperatures differ across a weather system.
Temperature information is also useful when combined with precipitation data. For example, a forecast involving cold air and incoming moisture may require closer attention to the possibility of snow or freezing conditions.
4. Wind and Jet Stream Maps
Wind information helps explain how air moves through the atmosphere. Surface wind maps show conditions closer to the ground, while upper-atmosphere maps can reveal larger circulation patterns.
The jet stream is a band of strong winds high in the atmosphere that influences the movement of many weather systems. Observing its position can help explain why storms follow particular paths or why temperature patterns change over a large region.
Such maps are particularly valuable to weather enthusiasts who want to understand the broader meteorological processes behind a forecast.
5. Precipitation Totals
Precipitation maps summarize how much rain or other precipitation has accumulated over a specified period. Intellicast's historical map offerings included daily and weekly precipitation totals.
Accumulation maps differ from live radar. Radar focuses on the distribution and movement of precipitation, whereas a precipitation-total map helps show how much has fallen over time.
These maps are relevant to gardening, agriculture, drainage management, flood awareness, and outdoor planning. However, users should distinguish between estimated precipitation totals and measurements from local rain gauges.
6. Surface Weather Analysis
Surface analysis maps present information about atmospheric pressure, fronts, and weather conditions near the Earth's surface.
They help users understand how air masses interact and how weather systems are organized. Cold fronts, warm fronts, and low-pressure systems can all influence the likelihood of rain, thunderstorms, temperature changes, or stronger winds.
Surface analysis is especially useful when a user wants to understand not only what the weather is doing but also why conditions are changing.
7. Forecast Maps and Regional Weather Views
Forecast maps provide a projected view of weather conditions for a future period. Intellicast's historical map directory included surface forecasts for several lead times, including 12-hour, 24-hour, 36-hour, and 48-hour periods.
These products offered a convenient way to examine expected regional developments. They could help users compare forecast scenarios and identify broad patterns in the movement of weather systems.
Forecasts become less certain as the prediction period extends, particularly when thunderstorms or rapidly changing atmospheric conditions are involved. A map should therefore be interpreted alongside updated local forecasts and official warnings.
How Intellicast Helped Users Track Severe Weather
Severe weather can develop quickly, making timely information important for personal safety and planning. Intellicast's map-centered approach helped users observe storm activity and understand the regional context of changing weather.
Monitoring Thunderstorms and Heavy Rain
Radar imagery can reveal clusters of precipitation and help users follow thunderstorm activity. By watching an animated sequence, people can identify the general direction in which a precipitation area is moving.
However, radar imagery alone cannot reliably determine whether a storm will produce a tornado, damaging winds, or large hail. Specialized warnings and official severe-weather information remain essential.
Following Winter Storms
Winter weather often involves a complicated mix of rain, snow, sleet, and freezing rain. Temperature maps, radar imagery, and broader surface analysis can help explain where these conditions may occur.
Even a small temperature difference near freezing can affect road conditions and travel safety. For that reason, weather maps are most useful when interpreted alongside location-specific forecasts.
Understanding Flood Risks
Heavy or persistent precipitation can increase the risk of flooding, particularly in areas with saturated soil, poor drainage, or nearby waterways.
Precipitation totals and radar observations can help users recognize potentially concerning patterns. Nevertheless, flooding depends on more than rainfall alone, and radar should not be treated as a substitute for official flood alerts or evacuation instructions.
What Happened to Intellicast.com?
Intellicast.com no longer functions as the original independent weather website. Beginning January 17, 2019, visitors were redirected toward Weather Underground, where a selection of familiar map categories and related weather tools became available.
This distinction is important because historical articles, archived screenshots, and old bookmarks may suggest that the original Intellicast interface is still available in precisely the same form. In reality, the platform underwent a transition, and its previous website experience was retired.
Why Did the Platform Change?
The transition brought Intellicast's established weather products into a larger digital weather environment. Maintaining weather services involves substantial technical requirements, including data processing, map generation, infrastructure, software maintenance, and support for different devices.
Consolidating related products can make it easier for an operator to manage its technology and present weather information through a common platform. It can also change the interface, organization of maps, and way users access familiar features.
The transition does not mean that weather radar or satellite forecasting disappeared. Rather, the original Intellicast brand stopped serving as the primary independent destination for those tools.
Are Intellicast Maps Still Available?
Weather-related map products associated with the Intellicast transition have been incorporated into the successor platform. However, the availability, appearance, and functionality of individual maps may change over time.
Users should not assume that every historical Intellicast feature, map layer, or interface element remains identical to its earlier version. The safest approach is to evaluate the currently available weather products rather than rely on descriptions of the old website.
Intellicast's Current Status and Latest Developments
As of October 2026, Intellicast is best understood as a legacy weather brand rather than a separate, actively maintained consumer weather website.
The key documented development remains its 2019 transition to Weather Underground. The historical Intellicast map directory explains that the website's identity was retired while its familiar technologies and features were carried forward.
There is no verified basis here to claim that Intellicast has relaunched as an independent service or that a completely new Intellicast application has replaced the former website.
For users searching for Intellicast today, three distinctions are helpful:
• Historical Intellicast: The original website and its familiar interface, which are no longer maintained as a standalone destination. • Successor weather products: Weather maps and forecasting tools offered through the platform that absorbed Intellicast. • The Intellicast name: A term that continues to appear in searches, old bookmarks, historical references, and discussions of radar forecasting.
These distinctions help prevent confusion between a discontinued website identity and the continued availability of related weather information.
Intellicast Compared With Modern Weather Services
Modern weather services often combine radar, satellite images, forecast models, current observations, and location-based alerts within a single interface. Intellicast helped popularize the importance of detailed visual weather information, but today's services offer a broader range of capabilities.
| Feature | Historical Intellicast experience | Modern weather services |
|---|---|---|
| Weather radar | A central feature | Commonly available with interactive layers |
| Animated radar | Supported weather movement visualization | Often available with additional controls |
| Satellite imagery | Regional and global imagery options | Frequently includes visible and infrared views |
| Forecasting | Forecast maps and local weather information | Often combines hourly, daily, and extended forecasts |
| Mobile access | Evolved with changing web technology | Commonly designed for smartphones and tablets |
| Weather alerts | Depended on the products and information available | May include location-based severe-weather notifications |
| Historical identity | Recognizable standalone brand | Often part of larger, integrated weather platforms |
This comparison is general rather than a claim that every modern service includes every listed feature. Available tools vary by provider, location, and subscription level.
What Made Intellicast Stand Out?
Intellicast's appeal came from its emphasis on maps and visual interpretation. It allowed users to explore weather patterns rather than simply receive a summarized prediction.
That approach helped make radar a familiar part of everyday weather checking. Users who learned to examine precipitation movement could develop a better understanding of short-term weather changes, although accurate interpretation still requires caution.
The platform's legacy also demonstrates that a useful digital product can remain memorable even after its original interface disappears. Its continued recognition reflects the value users placed on clear, detailed weather visualization.
Who Benefited Most From Intellicast?
Intellicast served several groups of users with different weather information needs.
Everyday Users
People checking whether rain was approaching, comparing temperatures, or deciding when to travel could use weather maps to supplement a standard forecast.
Travelers and Commuters
Regional radar and forecast maps helped users understand weather along a planned route. However, a regional map cannot replace road-condition reports, local warnings, or real-time travel information.
Outdoor Enthusiasts
Hikers, campers, cyclists, gardeners, and other outdoor enthusiasts could use weather imagery to better understand precipitation patterns and changing conditions.
Weather Enthusiasts
People interested in meteorology benefited from examining radar loops, satellite imagery, temperature distributions, and surface analysis. These visual products made it easier to connect observed weather with larger atmospheric patterns.
Professionals and Planners
Some outdoor operations and planning activities benefit from regional weather information. Nevertheless, businesses with safety-critical requirements should use appropriate professional forecasting services and authoritative warnings rather than depend on a consumer website alone.
Advantages and Limitations of Intellicast
Intellicast's historical strengths and limitations help explain its place in online weather forecasting.
Main Advantages
• Visual clarity: Weather maps made complex atmospheric information easier to explore. • Radar-focused experience: Users could observe precipitation patterns and their movement. • Multiple information layers: Temperature, satellite, wind, and precipitation maps offered different perspectives on weather. • Regional awareness: Larger maps helped users understand conditions beyond their immediate location. • Educational value: The visual tools encouraged users to learn how weather systems develop and change.
Main Limitations
• Discontinued standalone website: The original interface is no longer available as an independently maintained service. • Changing product availability: Features associated with the former platform may have been moved, redesigned, or retired. • Forecast uncertainty: Radar and forecast maps cannot guarantee the exact timing or severity of local conditions. • Coverage limitations: Radar quality and observation availability vary by geographic location and atmospheric conditions. • Need for official warnings: Specialized alerts and emergency guidance remain essential during dangerous weather.
These considerations are relevant when evaluating Intellicast's history and choosing a current tool for weather monitoring.
How to Interpret Weather Maps Effectively
Although Intellicast is no longer a standalone service, understanding its former tools can help users make better use of modern weather platforms.
1. Start with the local forecast. Check expected temperatures, precipitation chances, and the timing of weather changes. 2. Examine radar movement. Use animated radar to understand where precipitation is moving, but avoid assuming that the current direction will remain unchanged. 3. Compare radar with satellite imagery. Radar helps identify precipitation, while satellite imagery offers a broader view of cloud systems. 4. Review temperature conditions. Temperature differences can affect whether precipitation falls as rain, snow, or freezing precipitation. 5. Check official alerts. Consult authoritative weather warnings when thunderstorms, flooding, winter storms, or other hazards threaten your area.
Combining these steps provides a more complete understanding than relying on a single map or forecast symbol.
Frequently Asked Questions About Intellicast
Is Intellicast still operating?
Intellicast no longer operates as a separate weather website in its original form. Its transition to Weather Underground began in January 2019.
What was Intellicast best known for?
Intellicast was best known for detailed weather radar, animated precipitation maps, satellite imagery, temperature maps, and other visual forecasting products.
Why did Intellicast.com change?
The website was integrated into a larger weather platform, allowing related technologies and features to continue within a different online environment.
Can I still use Intellicast radar?
The original Intellicast radar interface is no longer maintained as a standalone product. Related weather maps may be available through successor services, but their appearance and functionality can differ from the historical version.
Was Intellicast a weather app or a website?
Intellicast was primarily recognized as an online weather service accessed through its website. Its defining identity was its collection of weather maps and forecasting tools rather than a single mobile application.
Was Intellicast reliable for weather forecasting?
Intellicast provided useful weather information and visual tools, but no weather service can guarantee perfect forecasts. Radar observations, forecast models, and local conditions all have limitations. For hazardous weather, official warnings should take priority.
What is Intellicast's legacy?
Intellicast's legacy lies in its contribution to accessible, map-based weather information. It helped users become familiar with interactive radar and encouraged a more visual approach to understanding local and regional weather conditions.
Conclusion
Intellicast occupies an important place in the evolution of online weather forecasting. Its radar maps, satellite imagery, temperature displays, and surface analysis tools helped users explore weather conditions in greater detail than basic forecasts allowed.
The service's major transition in January 2019 ended its role as an independent website, while related technology and features continued within a successor platform. Today, Intellicast is primarily a historical weather brand associated with detailed radar and interactive mapping.
For anyone researching Intellicast, the essential point is to distinguish its original website from the weather tools that followed. Its history illustrates how online forecasting has evolved toward integrated platforms that combine visual maps, local predictions, and timely weather information.